Covid-19 Forecast

Covid-19 Forecasting

The graphs and data forecast depicted on this web site are the output from machine learning forecast models developed at Beyond Ordinary Software Solutions. These models are derived from the Team BOSS XPrize Pandemic Challenge submission and have been updated to include vaccination data and recent reporting trends.

This data and forecasts are not intended to be a public safety recommendation. These models are generated by a computer using data submitted by humans. There are errors in this process, errors that could result in elevated morbidity or even mortality. Listen to your regional health care professionals and their experts. Follow their guidelines. Use the forecast herein as an augmentation tool to further refine your approach to your own personal safety.

Last Updated: 14 June 2023

Forecast Period: 12/01/2022 through 08/31/2023

The models used in this forecast were trained and evaluated using linear PCA. The heatmap of the feature importances can be found here

WorldMap

8 Components, 17 Day Feature, 20% Holdout

Interactive Map

39 Components, 11 Day Feature, 20% Holdout

Interactive Map

84 Components, 22 Day Feature, 20% Holdout

Interactive Map

47 Components, 29 Day Feature, 20% Holdout

Interactive Map

US Map

8 Components, 17 Day Feature, 20% Holdout

Interactive Map

39 Components, 11 Day Feature, 20% Holdout

Interactive Map

84 Components, 22 Day Feature, 20% Holdout

Interactive Map

47 Components, 29 Day Feature, 20% Holdout

Interactive Map

UK Map

8 Components, 17 Day Feature, 20% Holdout

Interactive Map

39 Components, 11 Day Feature, 20% Holdout

Interactive Map

84 Components, 22 Day Feature, 20% Holdout

Interactive Map

47 Components, 29 Day Feature, 20% Holdout

Interactive Map

Canada Map

8 Components, 17 Day Feature, 20% Holdout

Interactive Map

39 Components, 11 Day Feature, 20% Holdout

Interactive Map

84 Components, 22 Day Feature, 20% Holdout

Interactive Map

47 Components, 29 Day Feature, 20% Holdout

Interactive Map

Forecast Caveats

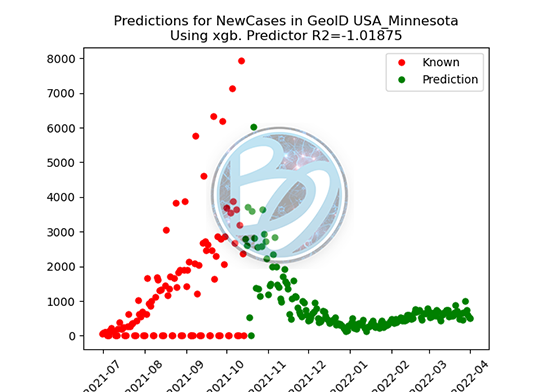
Almost every political region has a graph associated with it. Each graph shows the reported data in red and the prediction in green. The R2 factor is a measure of variability in the data. An R2 that is 1.0 is a good forecast, whereas an R2 that is negative requires some further interpretation and analysis. The R2 here is the holdout R2, which is the data not used in training that was used to validate the predictive (numerical) ability of the forecast.

Remember this is a forecast, not a prediction. A forecast is a trend, such as things going up or down. A prediction is a number. These models do not accurately predict morbidity and mortality. They have been accurate in forecasting trends and the start of such trends.

The forecast assumes the last reporting day's vaccination trend is the future trend, and that the prior year's same-day mobility data is the same in the future. Not all countries report separation data for each vaccine, so there is an "Other Vaccine" column that represents this mixed bag of vaccines.

Zombies occur in the model. Many countries re-stated historical data by applying corrections (negative reports) in the current reporting. These zombies remain in the model to maintain the historical noise and inaccuracy. The learning model should be able to remove/ignore these events and properly adjust.

References

  1. United States CDC Vaccination Data
    • https://data.cdc.gov/Vaccinations/COVID-19-Vaccinations-in-the-United-States-Jurisdi/unsk-b7fc
  2. World Covid-19 Trend Data from Oxford University
    • https://raw.githubusercontent.com/OxCGRT/covid-policy-tracker/master/data/OxCGRT_latest.csv
  3. Google World Mobility Data
    • https://www.gstatic.com/covid19/mobility/Region_Mobility_Report_CSVs.zip
  4. OWID Covid Testing
    • https://ourworldindata.org/coronavirus-testing
    • https://github.com/owid/covid-19-data.git
  5. UN Millennium Development Goals Indicators
    • http://mdgs.un.org/unsd/mdg/default.aspx
  6. World Bank Data Catalog
    • https://datacatalog.worldbank.org/dataset/health-nutrition-and-population-statistics
    • https://datacatalog.worldbank.org/dataset/health-nutrition-and-population-statistics-wealth-quintile
    • https://datacatalog.worldbank.org/dataset/population-estimates-and-projections
    • https://databank.worldbank.org/source/human-capital-index
  7. Wikipedia
    • https://en.wikipedia.org/wiki/List_of_countries_and_dependencies_by_population_density
    • https://en.wikipedia.org/wiki/Zero_lag_exponential_moving_average
    • https://en.wikipedia.org/wiki/Explained_variation
  8. World Population Review
    • https://worldpopulationreview.com/state-rankings/state-densities
  9. UK Government ONS
    • https://www.ons.gov.uk/peoplepopulationandcommunity/populationandmigration/populationestimates/bulletins/annualmidyearpopulationestimates/mid2019
  10. Scotland Census
    • https://www.scotlandscensus.gov.uk/documents/censusresults/release1a/rel1asbfig8.pdf
  11. Geert Hostede Sociological Trends
    • https://geerthofstede.com/research-and-vsm/dimension-data-matrix
  12. Scikit-learn
    • Machine Learning in Python, Pedregosa et al., JMLR 12, pp. 2825-2830, 2011.
  13. XGBoost
    • Chen, T. & Guestrin, C., 2016. XGBoost: A Scalable Tree Boosting System. In Proceedings of the 22nd ACM SIGKDD International Conference on Knowledge Discovery and Data Mining. KDD '16. New York, NY, USA: ACM, pp. 785–794. Available at: http://doi.acm.org/10.1145/2939672.2939785.
  14. LightGBM
    • Ke, G. et al., 2017. Lightgbm: A highly efficient gradient boosting decision tree. Advances in neural information processing systems, 30, pp.3146–3154.
  15. CatBoost
    • https://catboost.ai/en/docs/concepts/educational-materials-papers
  16. XPrize Pandemic Challenge with Cognizant
    • This work started as an entry into the XPrize Pandemic Challenge in 2020. We became finalists (Team BOSS) in that competition along with 47 other teams who did fantastic work in predicting this pandemic.
    • XPRIZE, a 501(c)(3) nonprofit organization, is the global leader in designing and implementing innovative competition models to solve the world’s grandest challenges. Active competitions include the $20 Million NRG COSIA Carbon XPRIZE, the $10 Million Rainforest XPRIZE, the $10 Million ANA Avatar XPRIZE, the $5 Million IBM Watson AI XPRIZE, $5 Million XPRIZE Rapid Reskilling, $5 Million XPRIZE Rapid COVID Testing, and $500K Pandemic Response Challenge. For more information, visit xprize.org.
    • Cognizant (Nasdaq-100: CTSH) is one of the world's leading professional services companies, transforming clients' business, operating and technology models for the digital era. Our unique industry-based, consultative approach helps clients envision, build and run more innovative and efficient businesses. Headquartered in the U.S., Cognizant is ranked 194 on the Fortune 500 and is consistently listed among the most admired companies in the world. Learn how Cognizant helps clients lead with digital at www.cognizant.com or follow us @Cognizant